New dwelling supply was relatively healthy through the COVID pandemic, while net overseas migration went backwards. Yet vacancy rates are tightening. Why is this happening?
Rental occupancy has been growing at a lower rate than new supply…
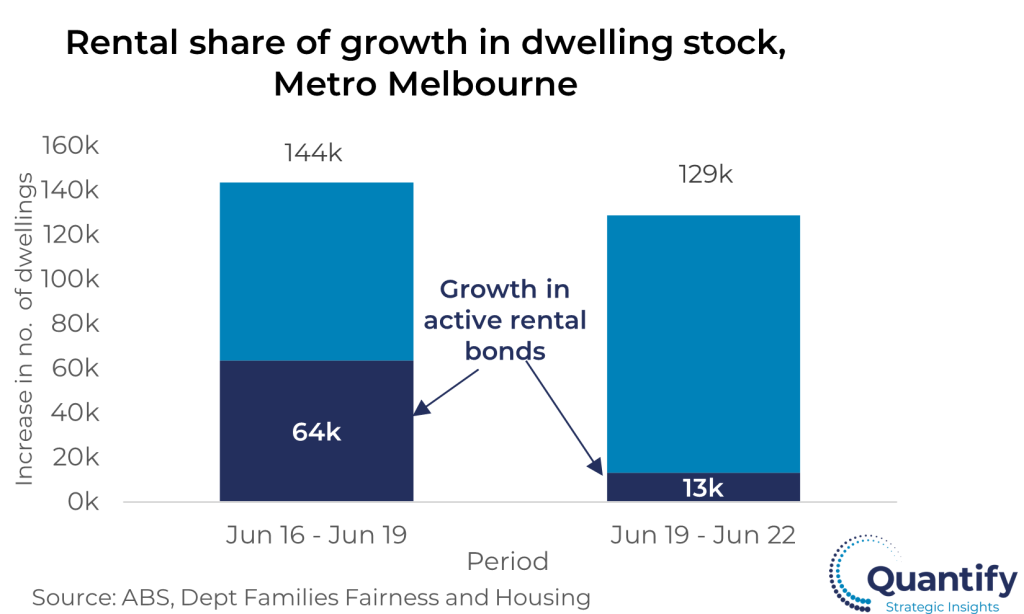
Amid the commentary around the rental crisis, the number of occupied rental dwellings has barely grown since the onset of the COVID pandemic, having increased by only 13,000 over 2019-2022 compared to 64,000 over the prior three years.
However, a lack of new dwelling supply does not appear to be the issue, with housing stock increasing by a still healthy 129,000 dwellings in this time, albeit below the 144,000 increase over 2016-2019.
So why are we seeing such tight rental markets in the face of a limited increase in the actual number of occupied rental dwellings? Where has all the rental stock gone?

…but investors aren’t holding stock back from the market.
A number of theories have been posited:
- Investors are pulling their dwellings out of the rental market to become short term lets such as AirBnB, etc.
- There has been a large increase in empty dwellings due to investors holding for speculation and/or a large proportion of recently completed apartments that remain unsold.
- Investors have retreated from the market and aren’t contributing to new rental stock.
- Or perhaps it was a combination of all of the above?
The first two reasons can largely be dismissed. It does not appear that dwellings have been deliberately withdrawn from the rental market. Data on AirBnb rentals from short term letting insights platform AirDNA, shows that short term lettings across Metropolitan Melbourne remain below pre-COVID (March 2020) levels. Assuming that these have been let in the regular rental market, they have actually added to supply.
Similarly, while there has been some increase in the percentage of stock that is vacant between the 2016 and 2021 Censuses, this can be largely accounted for by the difference in rental vacancy rates at each Census (around 10,000 dwellings) and nevertheless represent only a small portion of the 129,000 dwelling increase over 2019-2022.

Rather, investors are leaving the market, which is detracting from the rental stock.
The retreat of investors from the market, however, warrants a closer look.
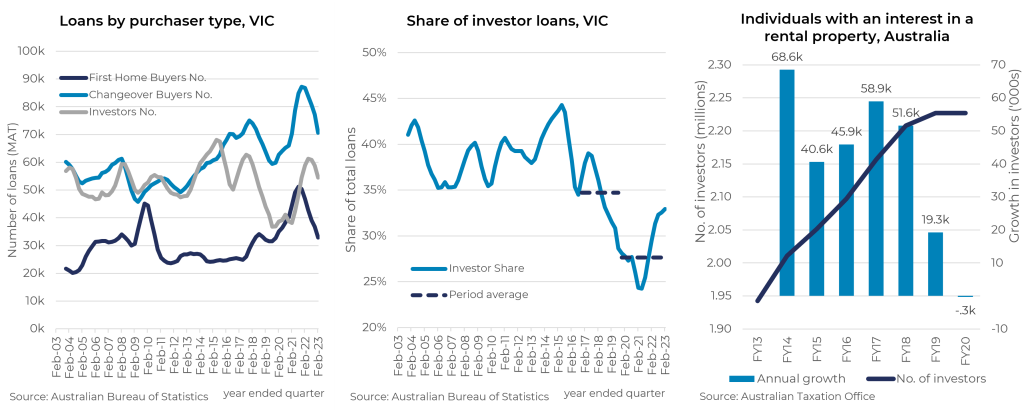
Investor demand fell to long term lows over 2017-2020 (left chart), while loans to investors averaged only 28% of total housing lending in Victoria over 2019-2022 (middle chart). This is well below the 35%-40% share over 2002-2016 that is consistent (after allowing for cash buyers such as downsizers, etc) with the one third or so share of rental households.
The number of individuals with an investment property has consequently declined (right chart). The ATO reports that the number of investor owners nationally fell (by 300) in FY2020 after rising by only 19,300 in FY2019 from a prior average of 53,000 per annum over FY2013-FY2018. ATO data for FY2021 is not yet available, but it is likely that the number of investor owners has declined again.
With record activity from first home buyers and changeover buyers through 2021, it appears that there have been a significant number of rental dwellings that are now owner occupied. The increase in homeowners is something that can be celebrated. However, the exit of investors has also reduced new rental supply that can be made available for future new tenants.

Meanwhile, rental pressures are exploding….
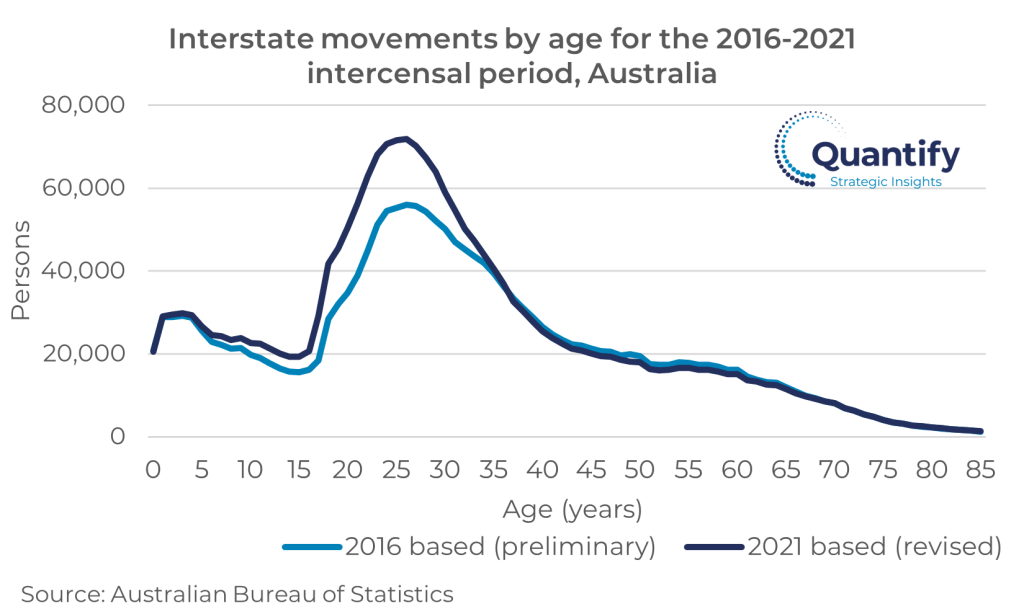
The retreat of investors not immediately apparent as it coincided with the larger shock of negative net overseas migration though the pandemic, which resulted in a reduction in rental demand and rising vacancy rates. The consequent lower rents saw the market recalibrate. Facilitated by a surging post-COVID employment market to support incomes, local household formation increased to fill the void. Many younger adults were able to move out of the family home or group households to rent by themselves.
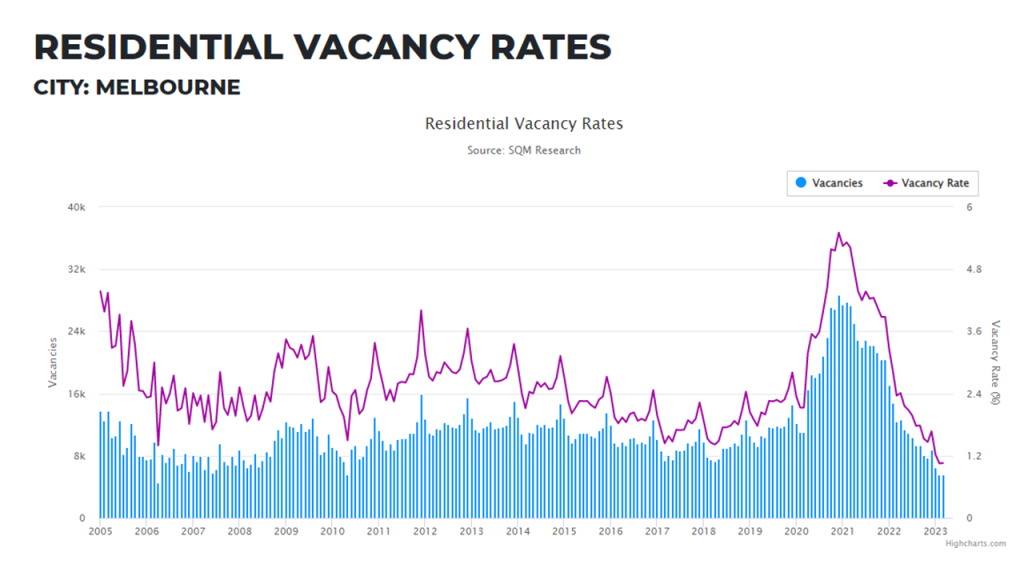
This saw the absorption of the record high vacancy rates at the onset of the COVID pandemic lockdowns and SQM Research reports that the market was largely in balance (vacancy rate of around 3%) at the start of 2022, just after international borders were reopened. Resurgent net overseas migration has since caused vacancy rates to subsequently tighten to long term lows with asking rents at or above pre-COVID levels and trending upwards.
Moreover, with rents in Victoria only able to be reviewed every twelve months, there is likely to be further upward pressure created on asking rents due to reduced churn and reduced mobility. Tenants would be expected to remain in place for as long as possible to avoid being exposed to a rising rental market.

…and the outlook remains challenging
At this stage, there does not seem to be much relief for rental markets. ATO data for FY2021 is likely to indicate there was a further reduction in investors and although in investor demand picked up in 2022, it is again trailing off at levels below that required to meet the surging demand from net overseas migration. Meanwhile, new dwelling completions are also falling away. Rents will continue to rise to the detriment of certain household types. Younger, single tenants have the option to defray high rents by sharing with others and splitting costs, or by moving back to the family home. However, families with children, who do not have that option, will find it increasingly difficult to afford to rent. Further increases in rents will also ultimately place more pressure on house prices.
The high hopes for a different dynamic coming out of the COVID pandemic, where workers were untethered to work and were able to take on more affordable housing options, and lower population growth pointing to a more moderate outlook for prices and rents, now seems a thing of the past. With net overseas migration surging and housing pressures likely to only intensify in the short term at least, it appears that the much promised ‘reset’ that was hoped for coming out of the pandemic has instead been a return to ‘business as usual’.


